Feeds:
Posts
Comments

Posts Tagged ‘pastmapper’

by Stephanie Krom, Kerry Heimer, and Salome Jeronimo

The PastMapper platform that Brad Thompson has created for the 1880, 1900, 1910, 1920, 1930, and 1940 census data of West 9th Street in Greenwich Village is visually quite different from the prototype map he created compiling the city directory entries of San Francisco from 1852-1853.  The San Francisco city directory map displays data through the use of colored markers distinguishing between residential and business locations.  The West 9th Street census data map, on the other hand, with most if not all entries being residential, simply offers outlines of each building structure. The only color difference on the West 9th Street map comes from the different decades that are represented on the block.

When clicking on the colored markers in San Francisco, a small pop-up appears offering the address of the particular location along with the name of the resident or business present there in 1852-1853.  The West 9th Street data shows a progression in the platform, including the race, sex, age, and occupations of the recorded residents.  This inclusion of additional information offers a more complete and useful representation of the individuals living in the area, as well as the changing social and architectural landscape over time.

HampPort2

Sister buildings The Hampshire and The Portsmouth.

Of particular interest, and something not included in the San Francisco data, is the information specific to the buildings that is offered for West 9th Street.  When clicked on, each listing provides the name of the building, the year it was built, the names of the builders and architects, and the list of residents. Knowing the date of the building’s erection and name of the architect is a particularly useful tool in finding out which buildings still stand today. For example, The Portsmouth is a building at 38-40 West 9th Street that was built in 1882 by architect Ralph Townsend in the Queen Anne style that was popular in America during the late nineteenth century. Today, the Portsmouth remains an apartment building on this scenic block in the Greenwich Village Historic District. PastMapper offers that, in 1910, a few decades after the Portsmouth was built, the building was home to at least sixty residents, ranging from white nuclear families with no servants to larger white families with several live-in servants. The professions listed for many of the 1910 residents of The Portsmouth, including lawyer, physician, and engineer, and the presence of many servants within the building indicate that the primary families in this building during the early-twentieth century were of the upper classes of New York society. This information is interesting particularly when compared to the people who live in The Portsmouth today. In many ways, the people of The Portsmouth have stayed the same – although there are no more “servants,” the families of The Portsmouth are certainly of the upper class. A three-bedroom apartment in The Portsmouth recently sold for $1,800,000.

W9th PastMapper

The real estate listing for unit 10 of The Portsmouth, which sold for $1.8 mil.
Courtesy Douglas Elliman

Another building constructed by Ralph Townsend in the 1880s was The Hampshire, located at 46-50 West 9th St between Sixth and Fifth Avenues, just one building away from The Portsmouth. The Hampshire is described as a Victorian style apartment building with terra cotta spandrels.  Interestingly, the building was once the home of novelist Dawn Powell.  The building is still an apartment building and is labeled as a Co-Op. At the time of the 1920s census, the flats on West 9th Street were occupied by upper-class working professionals.  Some of the census participants in The Hampshire listed their occupations as “nurse,” “broker,” “judge,”  and “editor.” According to current apartment listings, the average apartment in Greenwich Village is around 2.2 million dollars.  A one bedroom apartment in the Hampshire is currently listed at 1.1 million dollars. A one-bedroom apartment in this building sold in 2011 for $990,000.

hampshire

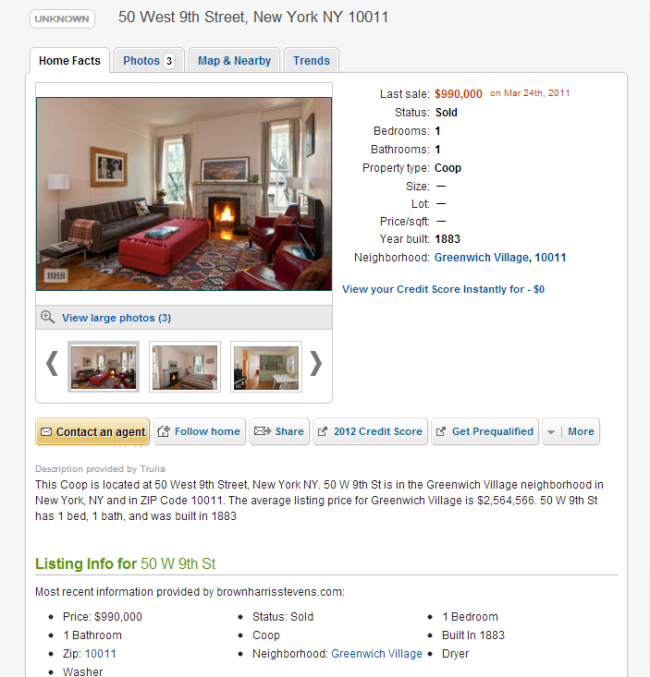
A real estate listing for an apartment in The Hampshire that sold for $990,000.
Courtesy Trulia.

This Greenwich Village census data project offers an indication of PastMapper’s ongoing and potential development as a resource for historical research. The use of the PastMapper platform as a tool for real estate history research may indicate that, in the future, PastMapper will be used by a variety of users, from scholars to apartment-hunters.

Read Full Post »

By Meg Leddy and Maggie Lee

Image

The alpha launch of Pastmapper provides a visualization (via digital mapping) of San Francisco census data from the years 1853, 1914, and 2012. This prototype highlights Pastmapper’s potential as a useful tool for teaching and learning, but ultimately raises questions concerning the platform’s usefulness in more serious scholarly endeavors.

A relatively new initiative in the digital humanities, Pastmapper structures and accumulates historical data through a series of layered maps. Easily recognizable to anyone who has used programs like google maps, Pastmapper’s basic interface is accessible and familiar. The first time user is met with a basic maps screen populated by small color-coded dots. Once clicked, the dots reveal specific information either about a person or a business connected with that location at a certain point in history. For example, we were able to discover that a clerk named E.M Cottrell lived on 17 Clay Street, right near the Central Wharf in 1853.

But the real appeal of Pastmapper is in the small navigation tool on the right hand side of the web page, which allows the user to see the same urban geography transformed by the passage of time. Those interested in San Francisco history might find it fascinating to discover that what was once the Central Wharf is now the San Francisco Ferry Building. Users can easily access the scroll to zoom tool in order to gain more precise access to streets and neighborhoods. The patterns and accumulations of dots provide fascinating visual insight into population and structural density, certainly interesting for any student of urban history. Although more graphic visualizations (perhaps images or photographs?) would add to the website’s dynamism, Pastmapper’s ability to accumulate and communicate large-scale trends in statistical data suggest its vast potential as an innovative learning tool for students, specifically those who learn best through visual venues. The possibility of an app makes Pastmapper an even more accessible and useful tool for the historical hobbyist.

Ultimately though, it is difficult to determine how useful the Pastmapper interface is for more than a cursory and casual investigation of historical trends. The amount of information displayed in the prototype is quite limited, including only name, occupation, and address. Additionally, unless you know what you’re looking for, it can be nearly impossible to pinpoint the exact “dot” that will reveal the desired information. Additionally, the “layered” aspect of the platform results in quite a bit of confusion. E.M. Cottrell of 17 Clay Street still appeared on the 2012 map of San Francisco, despite his almost certain passing in the over 150 year interval. This seems like a large oversight in Pastmapper’s structure. Perhaps this is something that will be addressed and added as the project moves forward.

Regardless, through our collaboration with Pastmapper we’ve certainly learned a lot. Although we have yet to see a visualization of our own Greenwich Village data, we’ve enjoyed being part of this cutting edge project. Pastmapper is easily google-able, and seems to have received a great deal of attention in the wider digital humanities community. Who knows, maybe 20 years from now Pastmapper will be a commonplace tool for student inquiries into census data and broader historical patterns. Additionally, being part of the Pastmapper project gave us a newfound appreciation for how much grunt work goes into a comprehensive project like this. Simply touring the San Francisco visualization, would never have imagined the hours and hours of data recording, and as the complex process of digital mapping demonstrates, it doesn’t end with us. A project of this size requires collaboration between different groups and individuals. In fact, the Pastmapper site even suggests ways in which interested parties can help. At the top, Brad notes that he has already been contacted by many people interested in his project. We are looking forward to the visualization of our own West 9th Street data, as well as other innovations promised on the Pastmapper site. Pastmapper is a new and exciting way to visualize enormous amounts of data and search for patterns. It is really fun to be a part of this collaborative project and an interesting lesson in the possibilities and the limitations of census data.

Read Full Post »

What can our pastmapper data tell us about West 9th street in 1910? The majority of residents on West 9th identified as white –  in a rough calculation, 99% of our sample of 600 individuals were listed as such. Minority groups represented in the data include “Indian,” “Japanese” and “Black,” with the predominate minority self-identifying as “Black.” This vast racial divide was the most striking demographic disparity that emerged from the compilation of our data. Sex and marital status produced relatively standard results, with an expected majority of single people due to the presence of children, servants (who were predominately unmarried) and lodgers. In particular, several houses on west 9th consisted entirely of lodgers, who were predominately single, white men, with occupations varying from accountant to carpenter. Women lodgers were few and far between, with the majority identifying as wives of other lodgers. Single women lodgers did have a presence, albeit small. Interestingly, these women held the most unconventional occupations represented in the data, such as “companion” and “artist.”

1910 Census

1910 Census

Although there seems to have been little racial diversity, West 9th Street in 1910 was home to a fair number of relatively recent immigrants (1880s-1910). The majority were employed as servants within private households, while others were independently employed in various respectable working class occupations (such as bookkeepers and salesmen). The bulk of immigrants identified as German or Irish, with substantial numbers hailing from Canada, France, England and Italy. Interestingly, there seems to have been very little inter-marriage. The majority of residents were born from parents of the same nationality, with a few notable exceptions. Additionally, we found that very few residents of West 9th street were the product of a relationship between an immigrant and a U.S. citizen. For example, Ernest Warren, who was the head of his household, stands out as the son of an Englishman and a New Yorker. We saw no evidence of inter-marriage between people from countries that did not share a common language and/or culture. Correspondingly, segregation along national lines within households seems to be a dominant trend. Within the context of national movement, the majority of residents were born on the east coast, specifically Massachusetts, Connecticut, Pennsylvania and New Jersey. We were surprised to find a few residents who were born as far away as Texas and Indiana.

As mentioned above, the majority of households seem to have been structured according to the traditional format of a nuclear family (mother, father, children), often with the addition of live in servants (an average of three). This nuclear structure reflects contemporary patriarchal norms, as the vast majority of those who identified as the head of a household also identified as men. The wives of these men were predominately unemployed (“none” or “housework”), particularly when the head of household worked in a professional position. In the few scenarios in which women did serve as the head of their households, they most often identified as widows. Typically, the male head of a household held a professional position, such as a lawyer, physician, broker or engineer. Primarily, these men rented, rather than owned, their place of residence. Of the few who owned homes, most held positions of social authority, such as judges and naval officers. Family sizes seem to have been relatively standard, with an average of 2-3 children. However, it was not unusual to find an older relative, such as a mother-in-law, living with her married daughter’s family.

Ultimately, there was little that surprised us in the data collected from the 1910 census. We expected to see a high number of European immigrants, with the majority occupied as servants within private homes. We also anticipated that households and occupations would function within traditional structures of patriarchy. What did surprise us, however, was the diversity of occupations in this predominately working class street. Everything from physician to librarian to seamstress is represented, often all within the confines of the same boarding house. Ultimately, although we can draw general conclusions from our limited 12 pages of census data, we recognize the importance of understanding the process of census-taking as a subjective act of self-identification. The static “facts” which we use to paint a picture of west 9th street in 1910 cannot possibly reflect the fluidity of a more comprehensive reality.

Read Full Post »

While still a work in progress, Pastmapper exploits the best aspect of digital history, its interactivity.  Because the platform was launched from San Francisco, most of its information now focuses on that city.  The Pastmapper Main Page states “Current available listings” as including 1852 San Francisco, 1960 Minneapolis, 1966 Boston, 1966 San Francisco, and 1967 Oakland but provides no links to any of those maps.

The 1853 San Francisco trial posted on the Pastmapper website uses transcribed information from the 1852 A.W. Morgan & Company’s San Francisco City Directory and takes the user to a San Francisco map with dozens of placemarkers.  Some placemarkers open photos and other images, other placemarkers do not.  Toggling between 1853 and 2012 Google maps of San Francisco creates an easy visual comparison.  When the user toggles between the two maps, streets and topographical features change, but data points remain the same, giving the user a unique view of how the city has evolved over the past century and a half.  Changes in the city’s land mass between 1853 and 2012 mirror other online geographic comparisons such as a recent one after Hurricane Sandy that contrasted an 18th-century map with a current one.

pastmapper

Researchers may appreciate the visual mapping of history and the clear color distinction between people and businesses.  The visual impact of information like this is easy to understand and is a great alternative to reading a listing or directory, a task which quickly becomes tedious and confusing.  Pastmapper enables users to switch between years to see how one specific section has changed over time.  Additionally, users can click on individual business types (15 in total) and gain an understanding of how many and where those business were located.  The Google map platform allows users to zoom in and out and move around, a great tool for street-level examination and quick navigation.

However, since only 35.6% of the 1852 directory was geotagged, Pastmapper is not yet ready for academic use.  Too much information is missing.  In addition, the business category “other” is not defined and offers no explanation why.  This website did not clearly define why some business types were classified together and others stood on their own.  While one can assume “dry goods, books, stationery and household items” were lumped together because a store may sell all four items, it is not clear who demarked the boundaries.  Was it the directory or the Pastmapper transcribers?  In addition, while the color coding distinctions were based on whether an entry was a “business” (blue) or “people” (green), it was not effective.   The “people” classification can be found in “boarding houses and hotels,” “saloons, restaurants, entertainment,”  “groceries and provisions, produce, butchers and bakeries” and others.  Moreover, business classifications that show green markers also show blue ones.  Therefore, the distinction between colors and business types becomes meaningless.

Finally, differences between the 1853 and 2011 maps are not readily apparent.  The difference is on the shoreline and not the information keyed in.  For example, Miss Bella Livingston is listed as living on Dupont Avenue, Miss Bella Livingston during both time periods.  Considering the 158 year difference, it is doubtful that this is the same person.

At the same time, the maps help users compare changes such as damage to businesses, homes, and cities in different natural disasters throughout a city’s history.  A business that may have stood near the water at an earlier point in time uses the same address but stands further offshore some 200 years later.

Overall, Pastmapper is a great tool but its usefulness for academic research will only be found once it amasses more information and classification of that information is clarified. Pastmapper contains a great deal of carefully entered metadata with few visuals.  Clicking on “Random Page” takes users to more metadata with links, none of which resulted in any images. Pastmapper has a lot of potential, but it also has a long way to go to engage online users.  It needs a more welcoming home or main page, visuals that draw in users and show them what Pastmapper has to offer if they set up an account, and simpler representations of metadata.  It also needs more information to make the trails more productive. Once it ingests more information, Pastmapper has the potential to organize that data and become a more effective research application.

-Bonnie Gordon, Jackie Rider and Lynda Van Wart

Read Full Post »